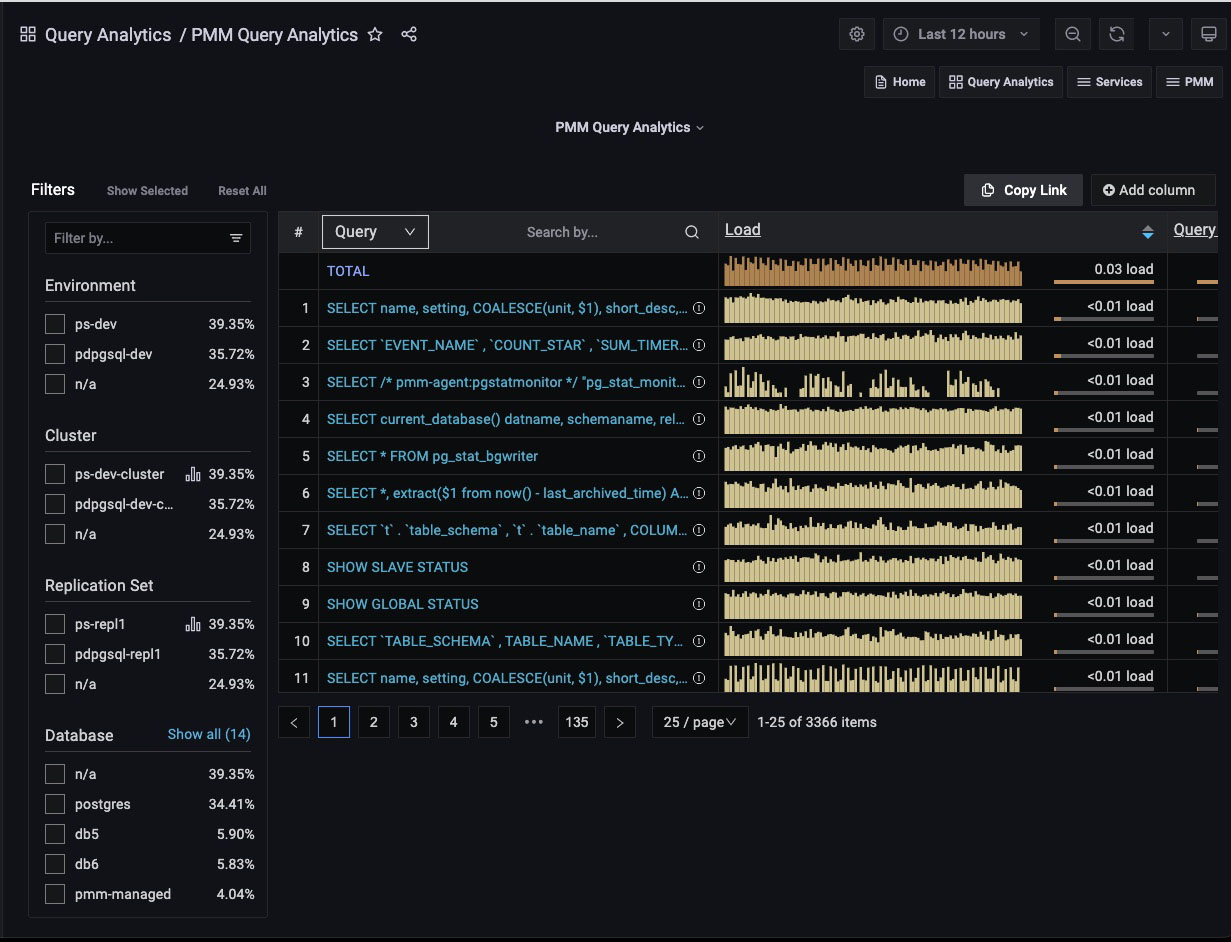
Overview Panel
To the right of the Filters panel and occupying the upper part of the dashboard is the Overview panel.
Each row of the table represents the metrics for a chosen object type, one of:
- Query;
- Service Name;
- Database;
- Schema;
- User Name;
- Client Host.
At the top of the second column is the dimension menu. Use this to choose the object type.
On the right side of the dimension column is the Dimension Search bar.
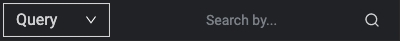
Enter a string and press Enter to limit the view to queries containing only the specified keywords.
Delete the search text and press Enter to see the full list again.
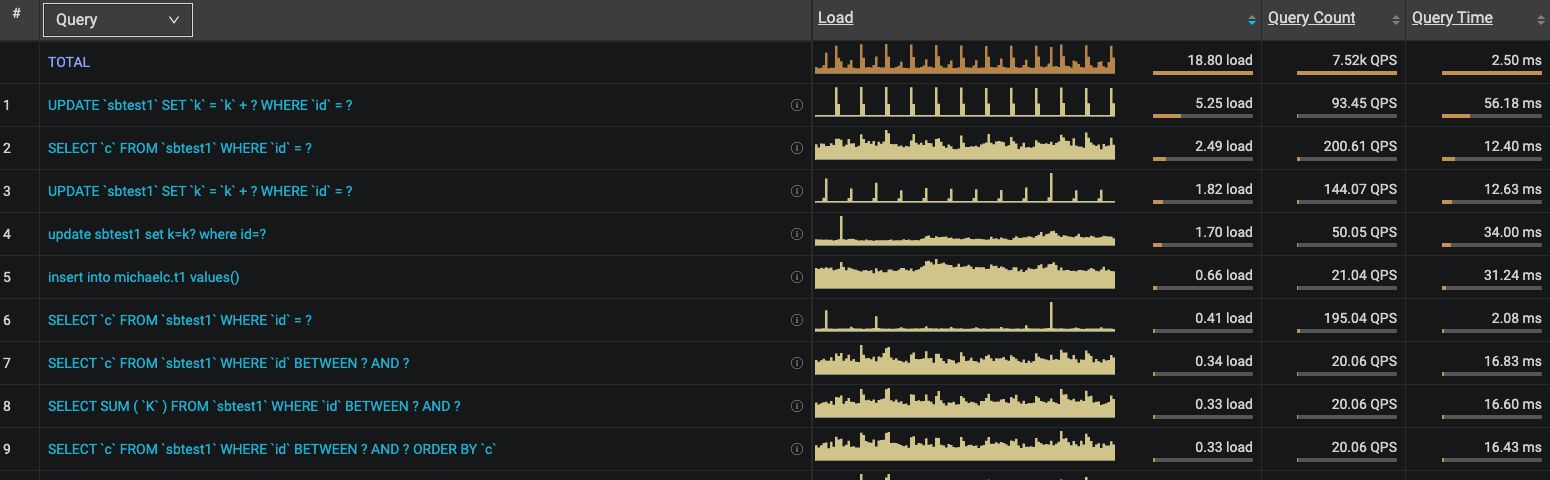
Columns
- The first column is the object’s identifier. For Query, it is the query’s Fingerprint.
- The second column is the Main metric, containing a reduced graphical representation of the metric over time, called a sparkline, and a horizontal meter, filled to reflect a percentage of the total value.
- Additional values are revealed as mouse-over tool-tips.
Tool-tips
- For the Query dimension, hovering over the information icon reveals the query ID and its example.
- Hovering on a column header reveals an informative tool-tip for that column.
- Hovering on the main metric sparkline highlights the data point and a tooltip shows the data value under the cursor.
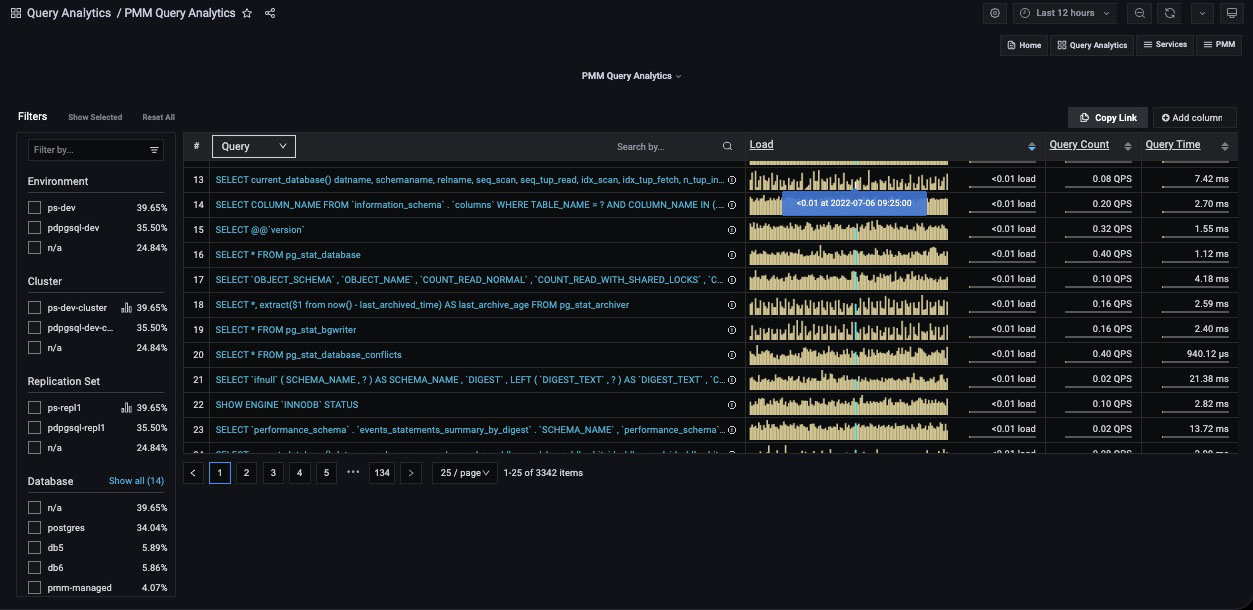
-
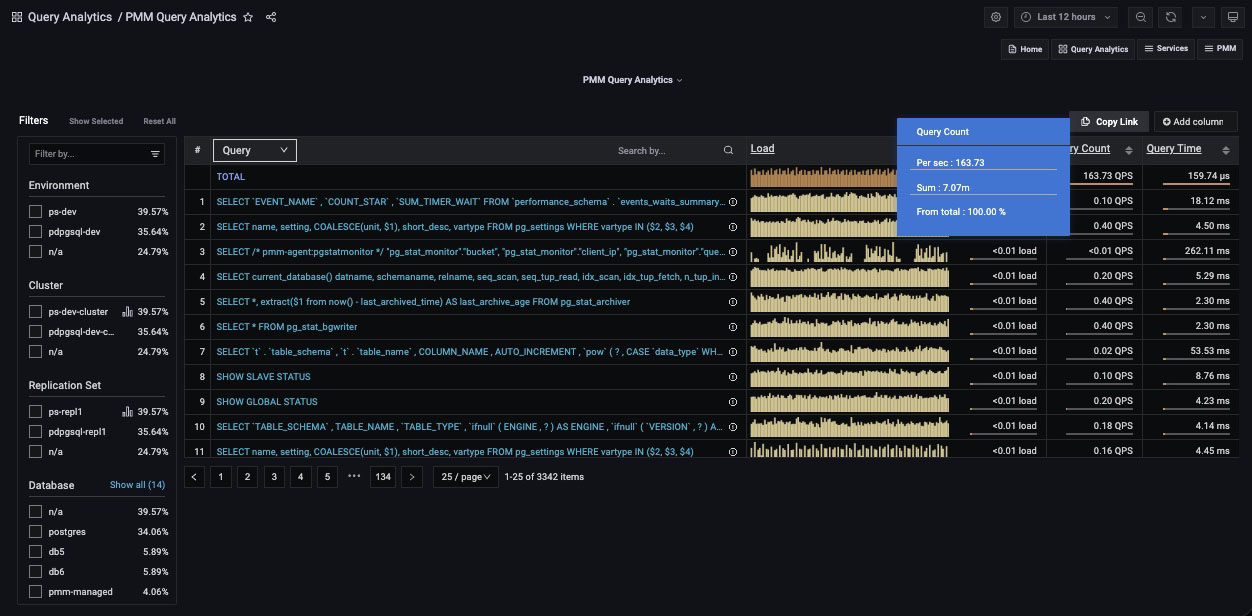
Hovering on the main metric meter reveals the percentage of the total, and other details specific to the main metric.

-
Hovering on column values reveals more details on the value. The contents depends on the type of value.
Adding and removing columns
-
Metrics columns are added with the Add column button.

-
When clicked, a text field and list of available metrics are revealed. Select a metric or enter a search string to reduce the list. Selecting a metric adds it to the panel.
- A metric column is removed by clicking on the column heading and selecting Remove column.
- The value plotted in the main metric column can be changed by clicking a metric column heading and selecting Swap with main metric.
Sorting
- The entire list is sorted by one of the columns.
- Click either the up or down caret to sort the list by that column’s ascending or descending values.
Pagination
-
The pagination device lets you move forwards or backwards through pages, jump to a specific page, and choose how many items are listed per page.

-
Queries are grouped into pages of 25, 50 or 100 items.
Get expert help
If you need assistance, visit the community forum for comprehensive and free database knowledge, or contact our Percona Database Experts for professional support and services.