Connect an external instance
Add general external services
You can collect metrics from an external (custom) exporter on a node when:
- there is already a pmm-agent instance running and,
- this node has been configured using the
pmm-admin configcommand.
Usage
pmm-admin add external --service-name=<service-name> --listen-port=<listen-port> --metrics-path=<metrics-path> --scheme=<scheme>
pmm-admin add external-serverless --external-name=<external-service-name> --host=<hostname> --listen-port=<listen-port> --metrics-path=<metrics-path> --scheme=<scheme>
Get data from external exporters
There two ways to get metrics from other exporters:
-
externalwill collect metrics from the exporter that is run on the same host as PMM Client’s connection to it by a port. (See more details withpmm-admin add external --help.) -
external-serverlessis useful for collecting metrics from cloud services. You need a host and port number to add it to PMM Server. (See more details withpmm-admin add external-serverless --help.)
Here are the differences between external and external-serverless types.
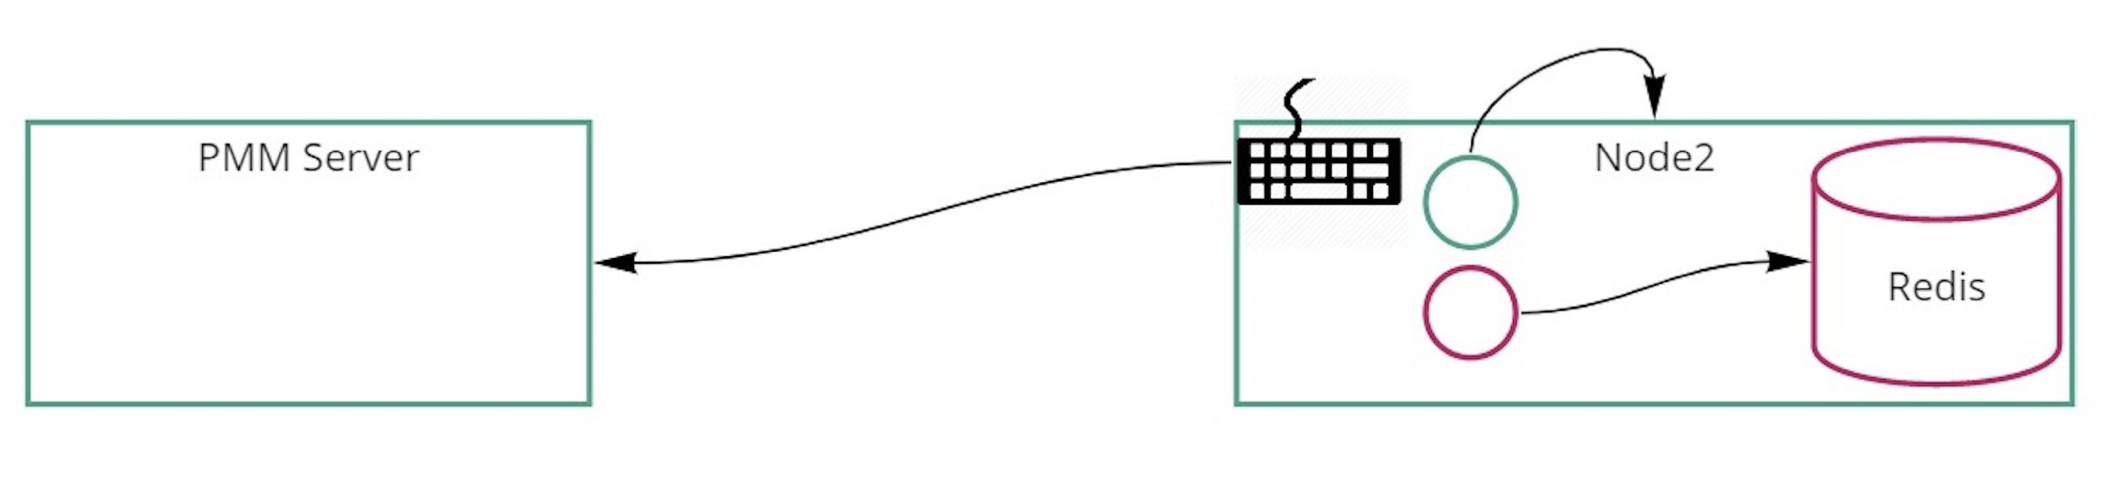
Connection schema of external exporter:
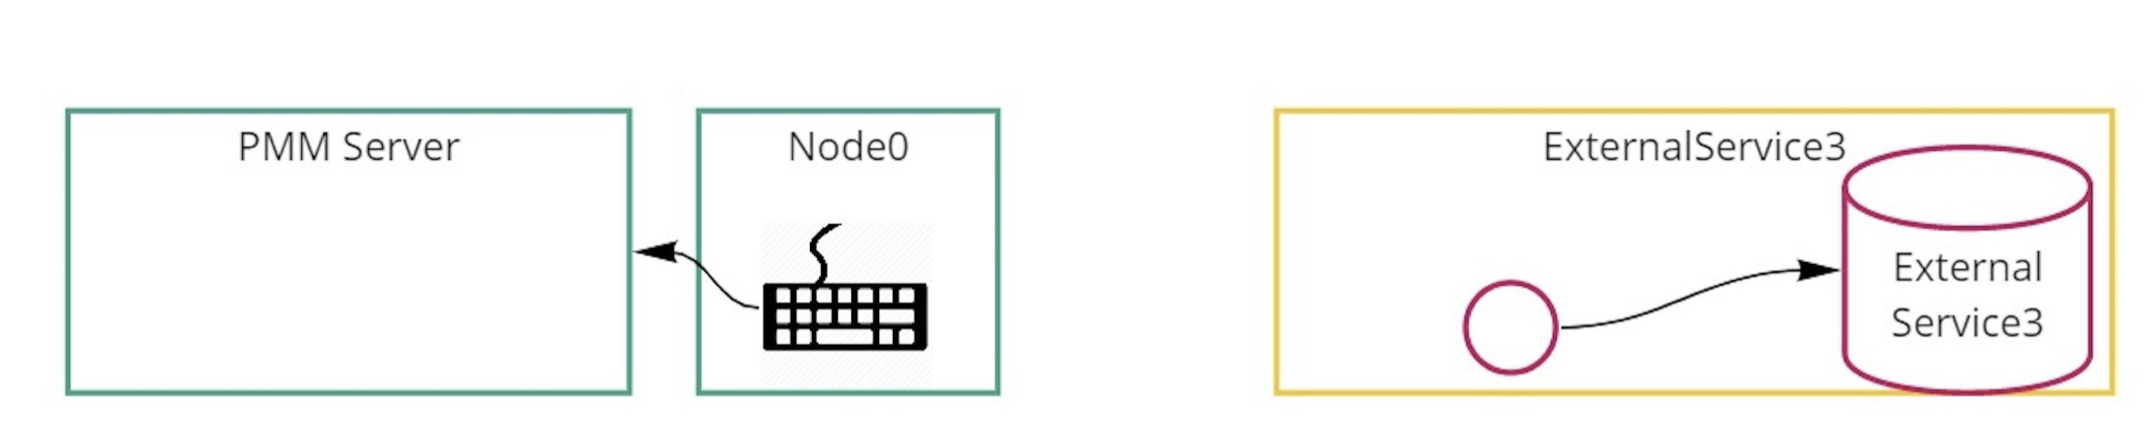
Connection schema of external serverless exporter:
Add a service not supported by PMM
PMM can collect any metrics in Open metrics or Prometheus exposition format. You must specify the host and port of these metrics using the pmm-admin add external or pmm-admin add external-serverless commands.
From this point, PMM will collect and store available metrics.
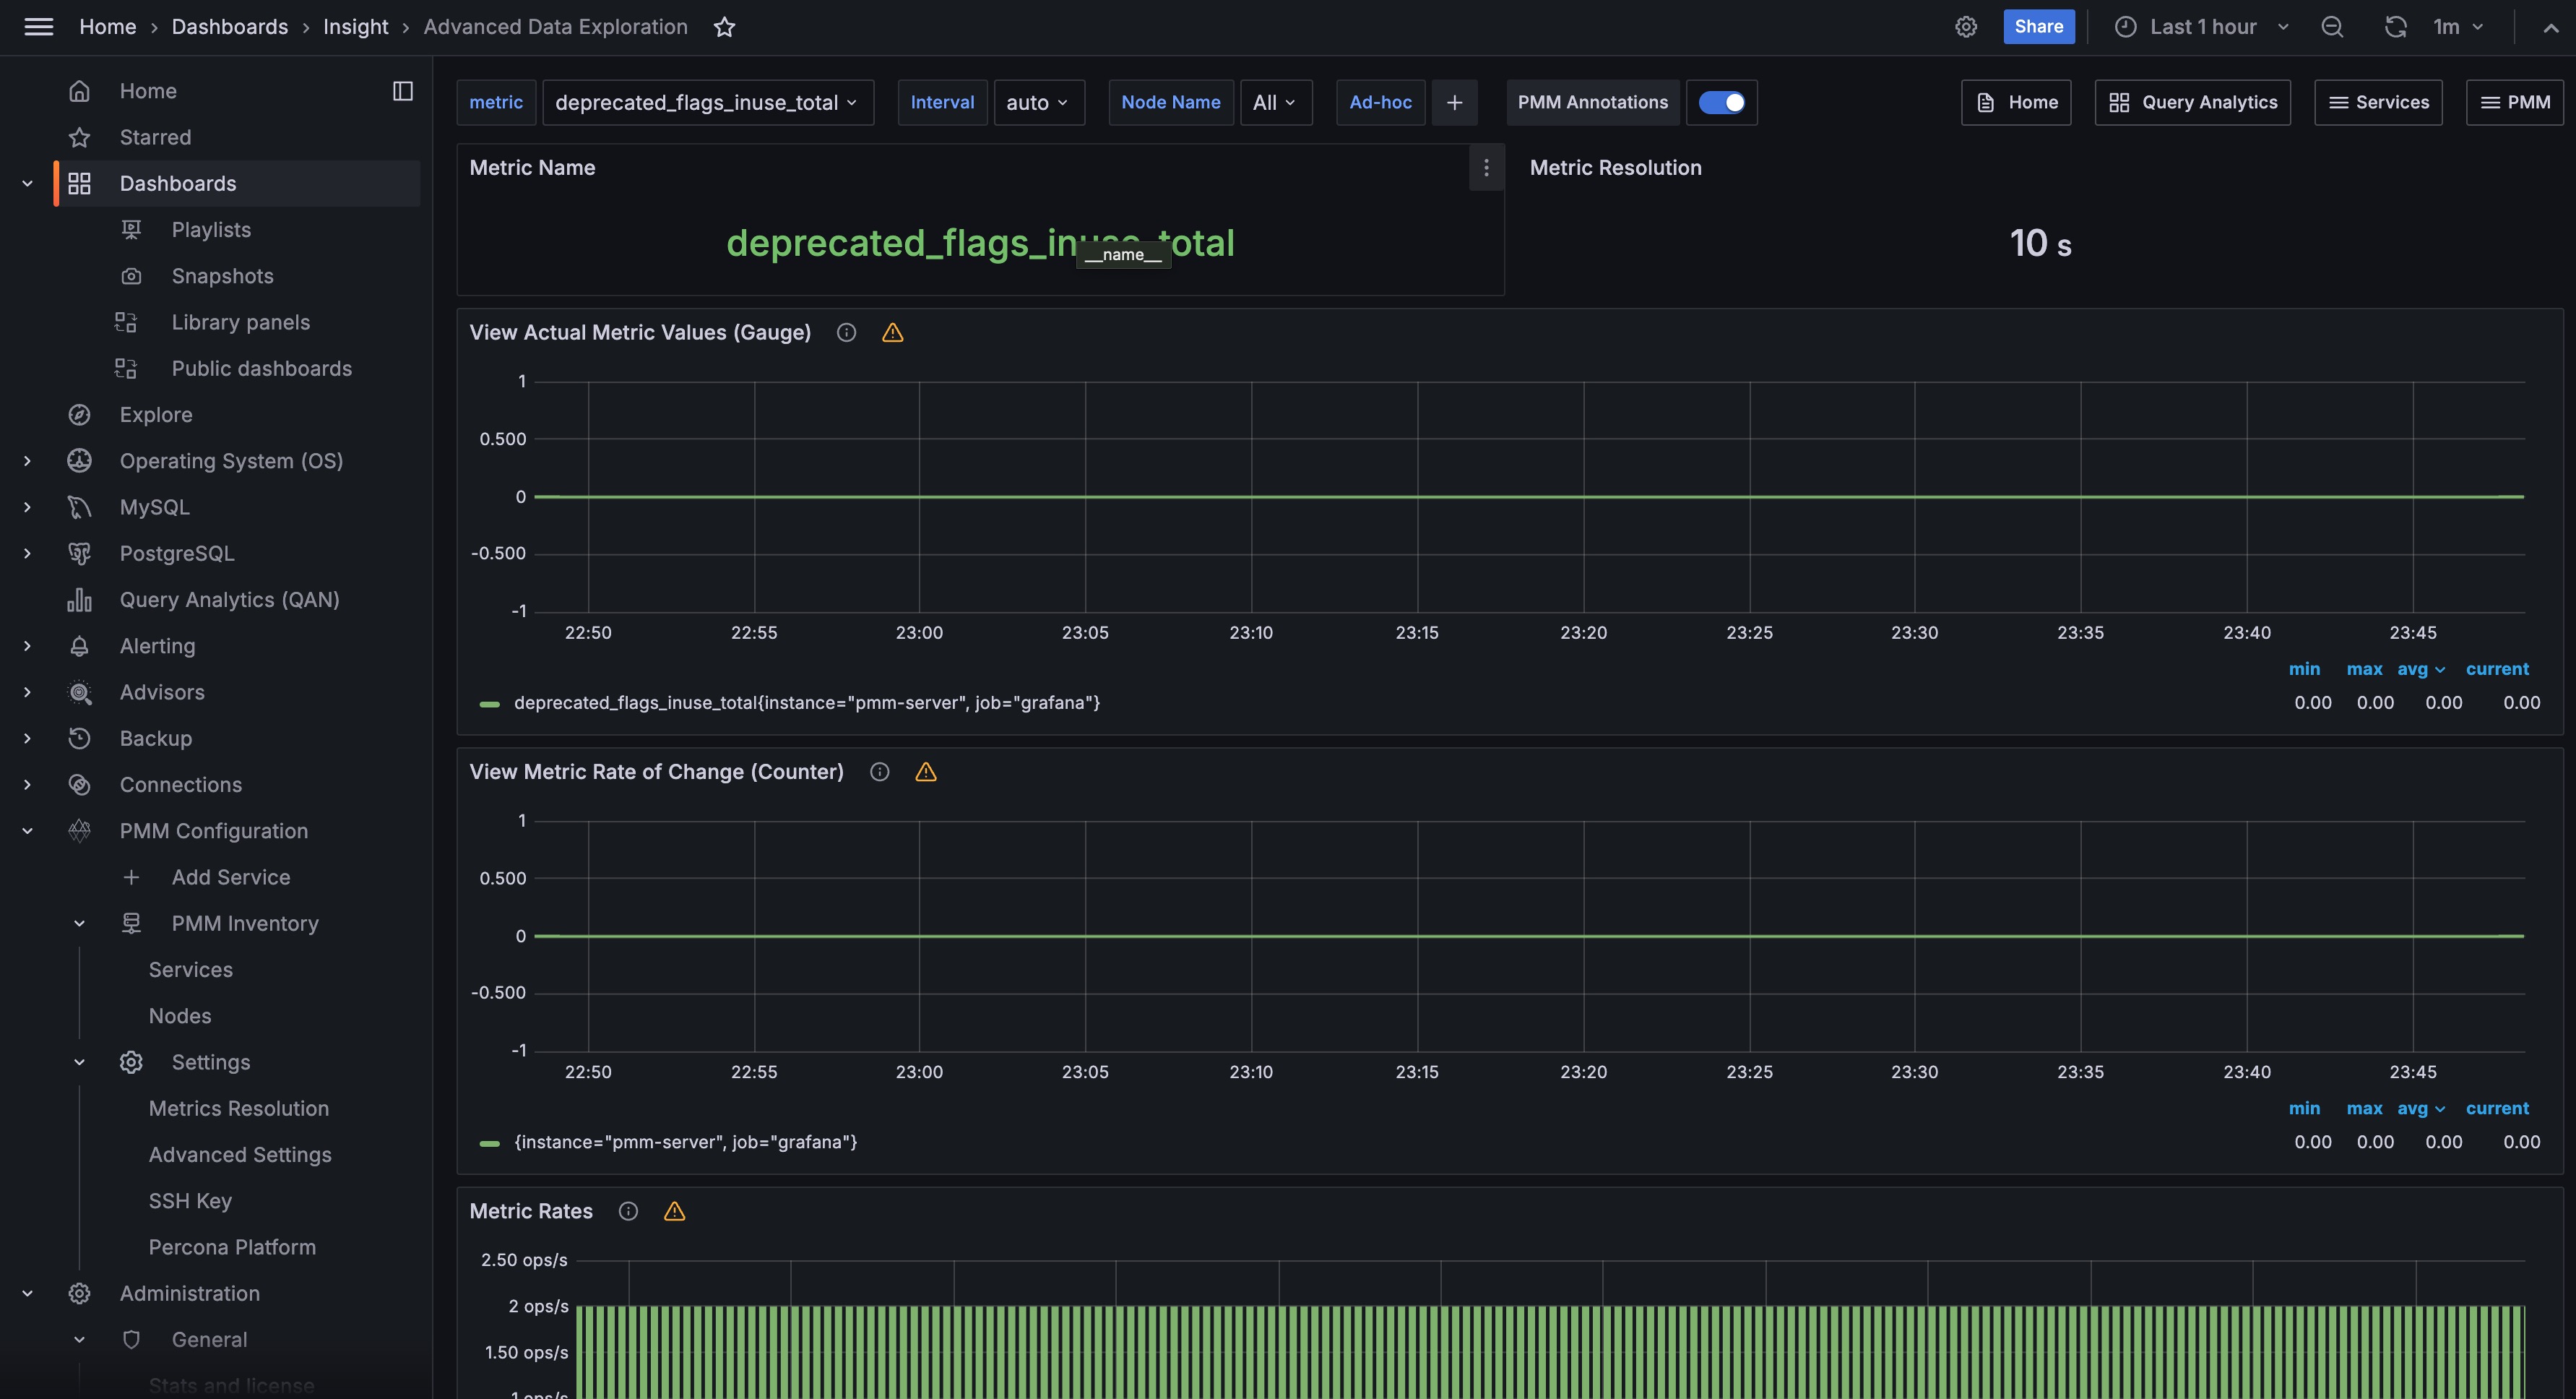
To browse and visualize collected metrics as a first step, we can look at the Advanced Data Exploration dashboard and select informative services and metrics.
Another way is to create a new Grafana Dashboard to PMM as needed.
One more way is to search for an already created dashboard at https://grafana.com/grafana/dashboards for the added exporter and import it into PMM.
Third-party exporters
You can find more exporters on the official Prometheus page.
Custom exporter
You can write a custom external exporter or extend your application to expose metrics in Prometheus format.
For more details see https://prometheus.io/docs/instrumenting/writing_exporters/.
Example
root@mysql1:~# pmm-admin add external --group=processes  --listen-port=9256
External Service added.
Service ID  : /service_id/6485f4fd-745b-4dfb-8b72-328e300f8b50
Service name: mysql1-processes
Group       : processes
- Add an exporter running on local port 9256 to the group called
processes. - Use the group and host names to automatically generate a service name.
- Use the default scheme and metrics path.
Add an external service via UI
To add an external service via PMM UI:
-
In the PMM web interface, go to Configuration → PMM Inventory → Add Instance.
-
Select External Service – Add a remote instance.
-
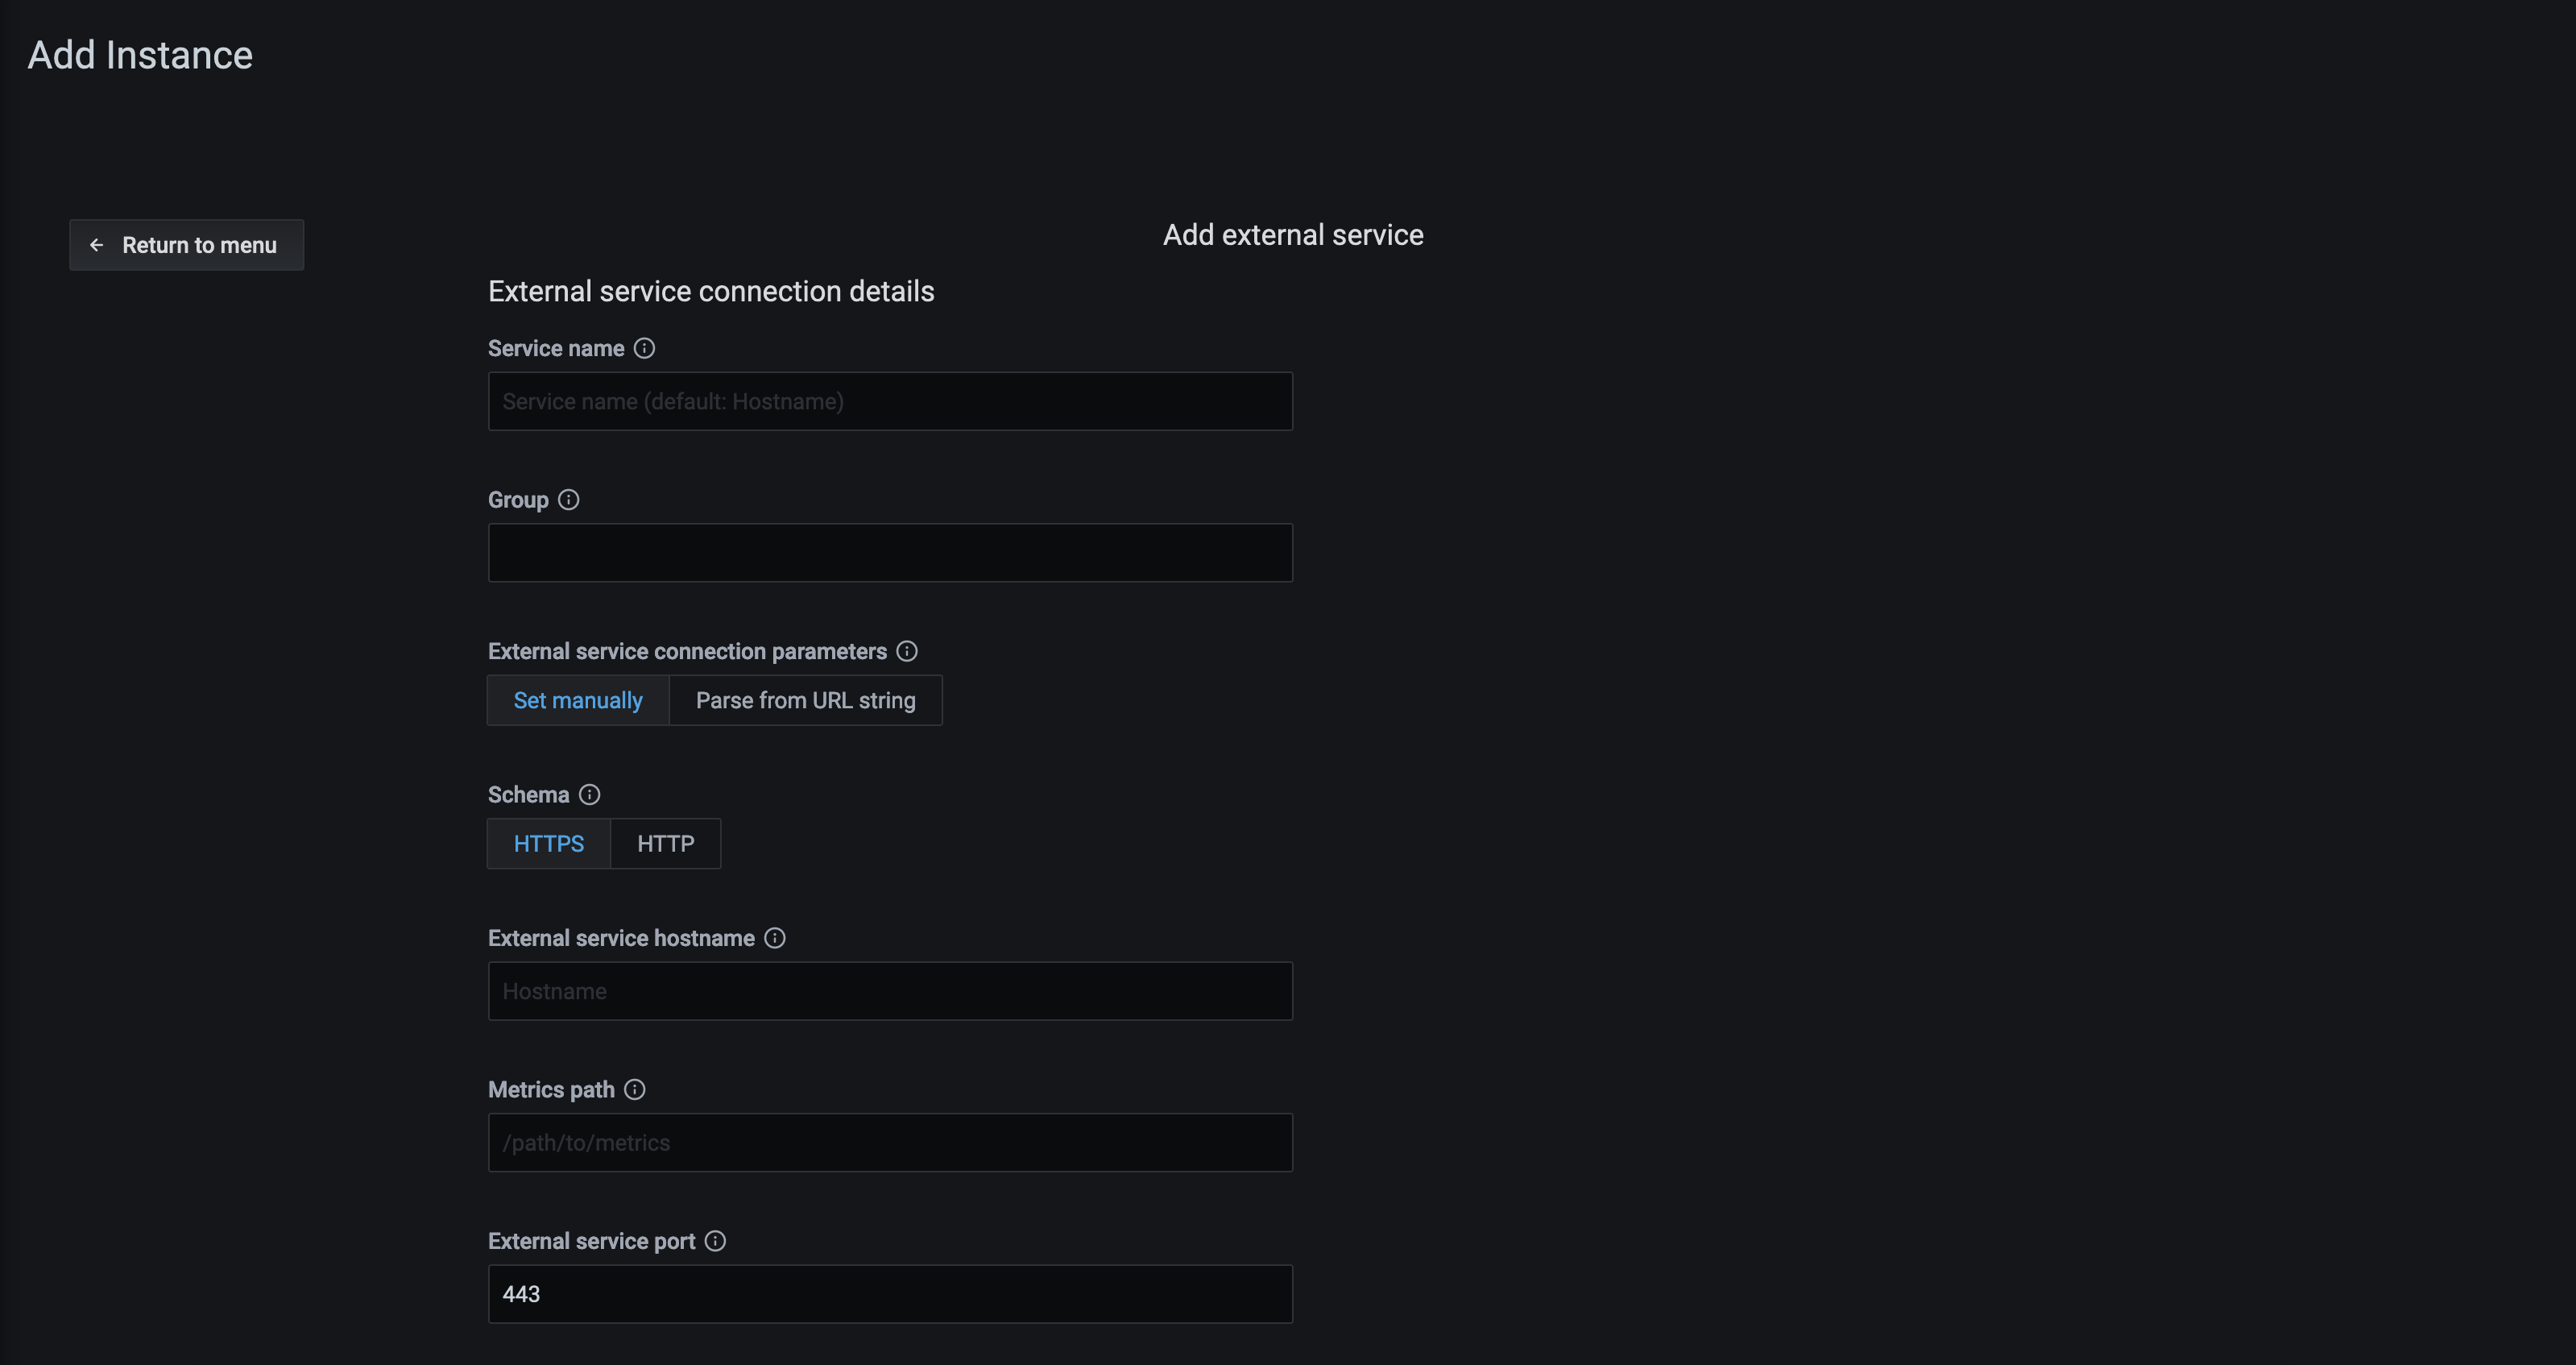
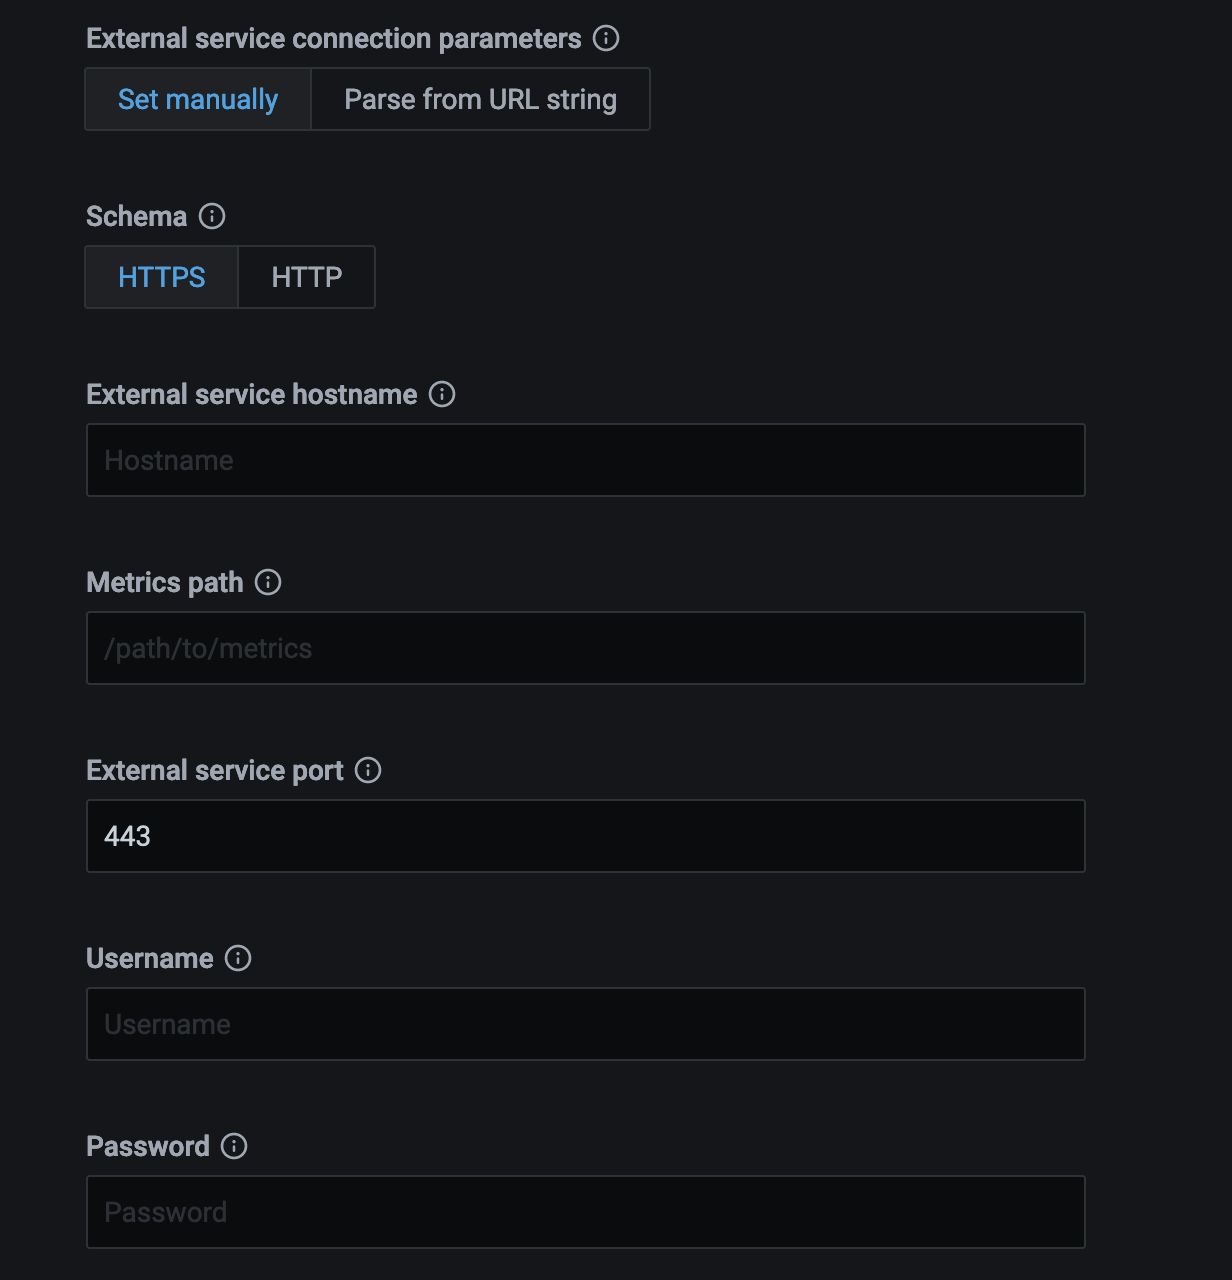
Fill the form and set the external service endpoint.
The endpoint can be set manually:
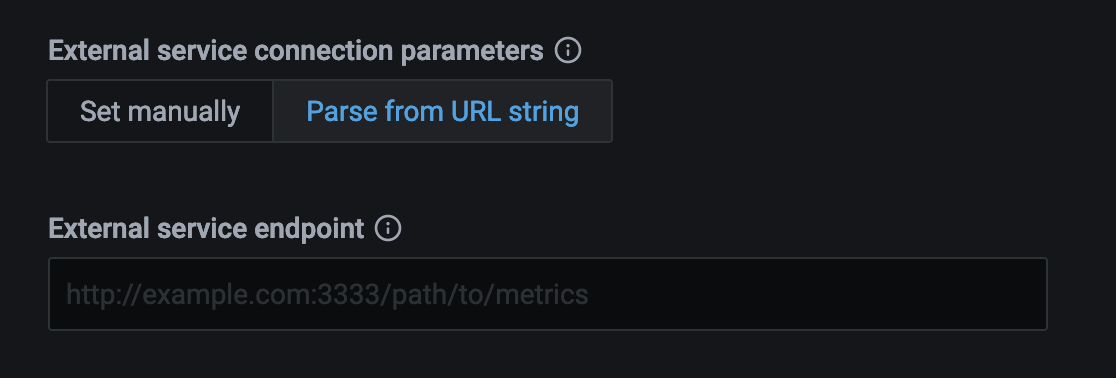
or by parsing required data from a URL string, in which case you only need to pass a valid URL.
Get expert help
If you need assistance, visit the community forum for comprehensive and free database knowledge, or contact our Percona Database Experts for professional support and services.