Alert rules and alert templates
Alert rules describe the circumstances under which you want to be alerted. The evaluation criteria that you define determine whether an alert will fire.
An alert rule consists of one or more queries and expressions, a condition, the frequency of evaluation, and the duration over which the condition is met. For example, you might configure an alert to fire and trigger a notification when MongoDB is down.
An alert rule can be in three possible states:
- Normal: Everything is working correctly and the conditions specified in the rule has not been met. This is the default state for newly created rules.
- Pending: The conditions specified in the alert rule has been met, but for a time that is less than the configured duration.
- Firing: Both the conditions and the duration specified in the alert rule have both been met.
It takes at least one evaluation cycle for an alert rule to transition from one state to another (e.g., from Normal to Pending).
Alert rules templates
PMM provides a set of Alert Rule templates with common events and expressions for alerting. These templates can be used as a basis for creating Alert Rules. You can also create your own templates if you need custom expressions.
You can check the alert templates available for your account under Alerting > Alert rule templates tab. PMM lists here the following types of templates:
- Built-in templates, available out-of-the-box with PMM.
- Templates downloaded from Percona Platform.
- Custom templates created or uploaded on the Alerting page > Alert Templates tab. You can also store your custom template files in your
/srv/alerting/templatesdirectory and PMM will load them during startup.
Accessing alert templates
To check the alert templates for your PMM instance, go to PMM > Alerting > Alert Rule Templates tab.
To check the full list of available PMM templates, see the List of available alert templates topic
Create alert rules from alert rule templates
This section focuses on creating an alert rule based on PMM templates. For information on working with the other alert types, check the Grafana documentation on Grafana Labs.
Provision alert resources
Before creating PMM alert rules, configure the required alert resources:
- Go to PMM Configuration > Settings > Advanced Settings and ensure that the Percona Alerting option is enabled. When this is disabled, the Alerting page displays only Grafana-managed alert rules. This means that you will not be able to create alerts based on PMM templates.
- Go to Dashboards and check the folders available for storing alert rules. If none of the available folders are relevant for your future alert rules, click New > New Folder and create a custom one.
- Go to Alerting > Alert rule templates and check the default PMM templates. If none of the templates include a relevant expression for the type of alerts that you want to create, click Add template to create a custom template instead.
Configure alert templates
Alerts templates are YAML files that provide the source framework for alert rules. Alert templates contain general template details and an alert expression defined in MetricsQL. This query language is backward compatible with PromQL.
Create custom templates
If none of the default PMM templates contain a relevant expression for the alert rule that you need, you can create a custom template instead.
You can base multiple alert rules on the same template. For example, you can create a pmm_node_high_cpu_load template that can be used as the source for alert rules for production versus staging, warning versus critical, etc.
Template format
When creating custom templates, make sure to use the required template format below:
- name (required): uniquely identifies template. Spaces and special characters are not allowed.
- version (required): defines the template format version.
- summary (required): a template description.
- expr (required): a MetricsQL query string with parameter placeholders.
- params: contains parameter definitions required for the query. Each parameter has a name, type, and summary. It also may have a unit, available range, and default value.
- name (required): the name of the parameter. Spaces and special characters are not allowed.
- summary (required): a short description of what this parameter represents.
- unit (optional): PMM currently supports either s (seconds) or % (percentage).
- type (required): PMM currently supports the
floattype.string,bool, and other types will be available in a future release. - range (optional): defines the boundaries for the value of a float parameter
- value (optional): default parameter value. Value strings must not include any of these special characters:
< > ! @ # $ % ^ & * ( ) _ / \ ' + - = (space) - for (required): specifies the duration of time that the expression must be met before the alert will be fired
- severity (required): specifies default alert severity level
-
labels (optional): are additional labels to be added to generated alerts
-
annotations (optional): are additional annotations to be added to generated alerts.
Template example
---
templates:
  - name: pmm_node_high_cpu_load
    version: 1
    summary: Node high CPU load
    expr: |-
      (1 - avg by(node_name) (rate(node_cpu_seconds_total{mode="idle"}[5m])))
      * 100
      > bool [[ .threshold ]]
    params:
      - name: threshold
        summary: A percentage from configured maximum
        unit: "%"
        type: float
        range: [0, 100]
        value: 80
    for: 5m
    severity: warning
    annotations:
      summary: Node high CPU load ({{ $labels.node_name }})
      description: |-
        {{ $labels.node_name }} CPU load is more than [[ .threshold ]]%.
Test alert expressions
If you want to create custom templates, you can test the MetricsQL expressions for your custom template in the Explore section of PMM. Here you can also query any PMM internal database.
To test expressions for custom templates:
- On the main menu in PMM, choose Explore > Metrics.
- Enter your expression in the Metrics field and click Run query.
For example, to check the CPU usage, Go to Explore > Metrics in your PMM dashboard and run the query expression below:
(1 - avg by(node_name) (rate(node_cpu_seconds_total{mode="idle"}[5m]))) * 100
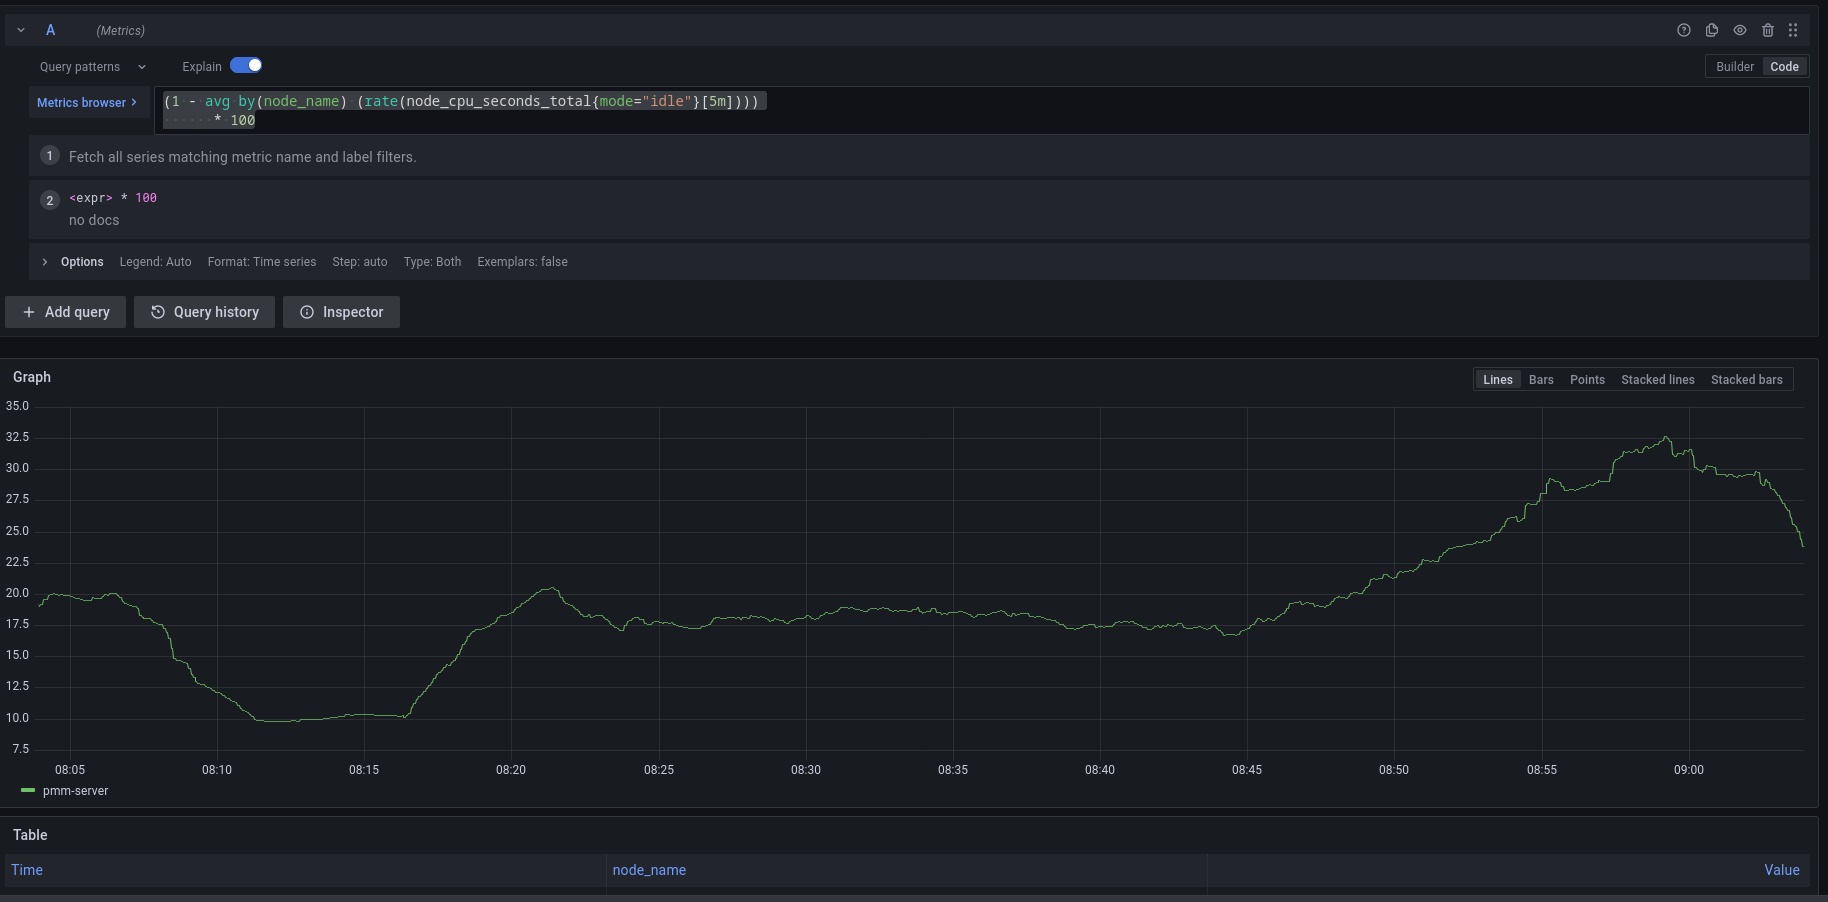
Note that to paste the query above, Explore must be in Code mode, and not in Builder mode.
Add an alert rule based on a template
After provisioning the resources required for creating Percona templated alerts, you are now ready to create your alert rule based on a Percona template.
If you want to learn about creating Grafana alerts instead, check out Grafana’s documentation:
- Go to Alerting > Alert Rules, and click New alert rule from template.
- On the Create alert rule from template page, choose the template on which you want to base the new alert rule. This automatically populates the Name, Duration, and Severity fields with information from the template. You can change these values if you want to override the default specifications in the template.
- From the Folder drop-down menu, select the location where you want to store the rule.
-
In the Filters section, specify if you want the alert rule to apply only to specific services or nodes. For example:
service_name=ps5.7. When creating alert rule filters, consider the following:- Filters use conjunction semantics. This means that if you add more than one filter, PMM will combine their conditions to search for matches: filter 1 AND filter 2 AND filter 3.
- Label must be an exact match. You can find a complete list of labels using the Explore menu in PMM.
-
Click Save and Exit to close the page and go to the Alert Rules tab where you can review, edit and silence your new alert.
Get expert help
If you need assistance, visit the community forum for comprehensive and free database knowledge, or contact our Percona Database Experts for professional support and services.