Details Panel
- Selecting an item in the Overview panel opens the Details panel with a Details Tab.
- If the dimension is Query, the panel also contains the Examples Tab, Explain Tab, and Tables Tab.
Details Tab
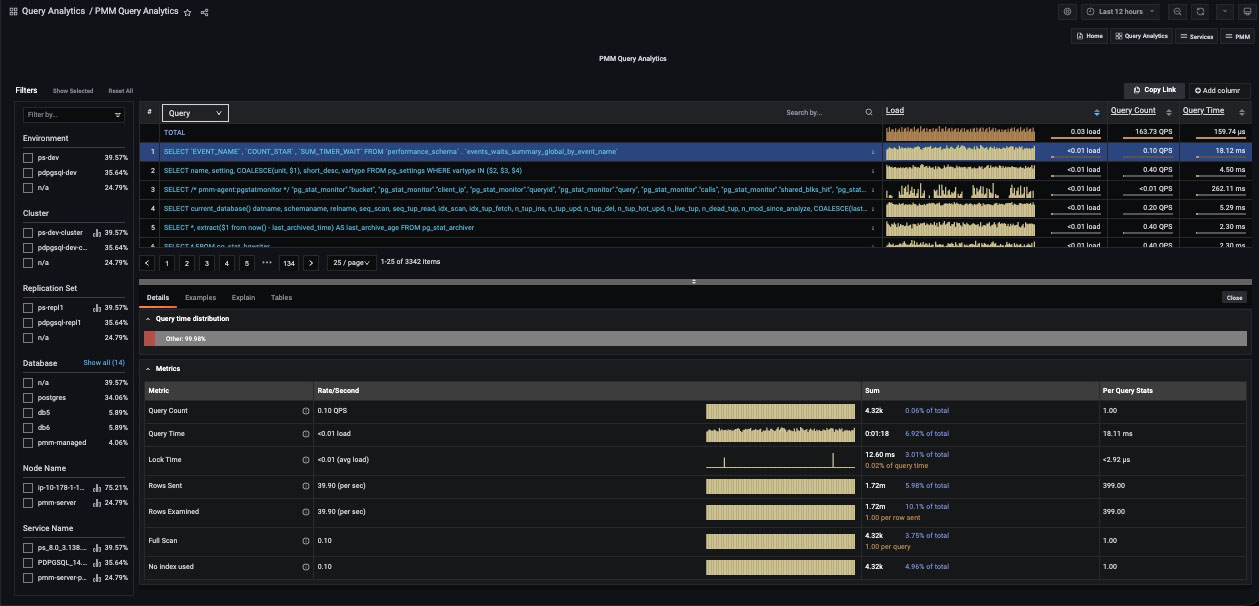
The Details tab contains a Query time distribution bar (only for MySQL databases) and a set of Metrics in collapsible subpanels.
-
The Query time distribution bar shows a query’s total time made up of colored segments, each segment representing the proportion of time spent on a named activity.
query_time: Statement execution time.lock_time: Time to acquire locks.blk_read_time: Total time the statement spent reading blocks (iftrack_io_timingis enabled, otherwise zero).blk_write_time: Total time the statement spent writing blocks (iftrack_io_timingis enabled, otherwise zero).innodb_io_r_wait: Time for InnoDB to read the data from storage.innodb_queue_wait: Time the query spent either waiting to enter the InnoDB queue, or in it pending execution.innodb_rec_lock_wait: Time the query waited for row locks.other: Remaining uncategorized query time.
-
Metrics is a table with headings:
- Metric: The Metric name, with a question-mark tool-tip that reveals a description of the metric on mouse-over;
- Rate/Second: A sparkline chart of real-time values per unit time;
- Sum: A summation of the metric for the selected query, and the percentage of the total;
- Per Query Stats: The value of the metric per query.
-
Each row in the table is a metric. The contents depends on the chosen dimension.
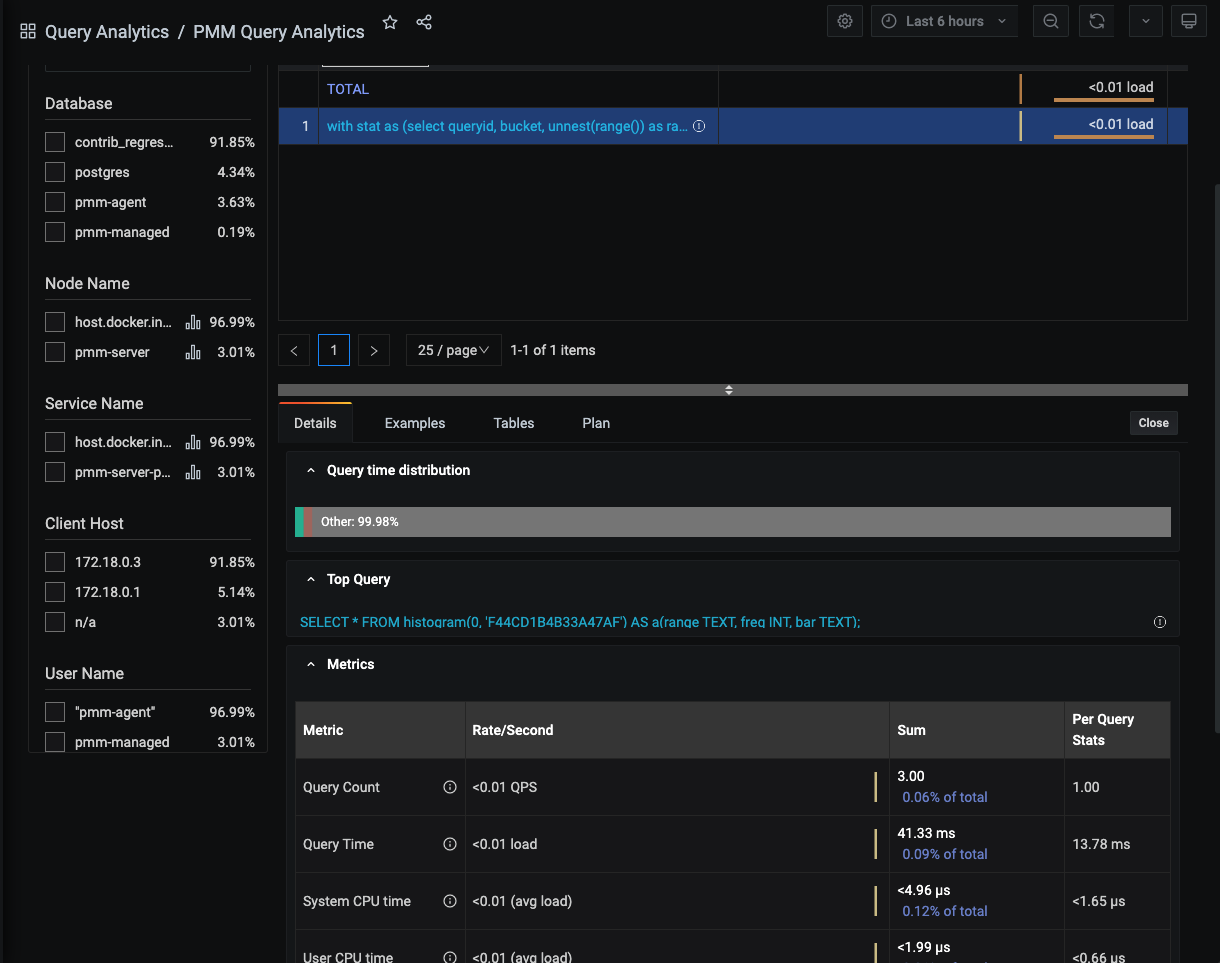
For PostgreSQL queries (when using pg_stat_monitor) the top query will also be shown in the details section if the query was called by an outer query.
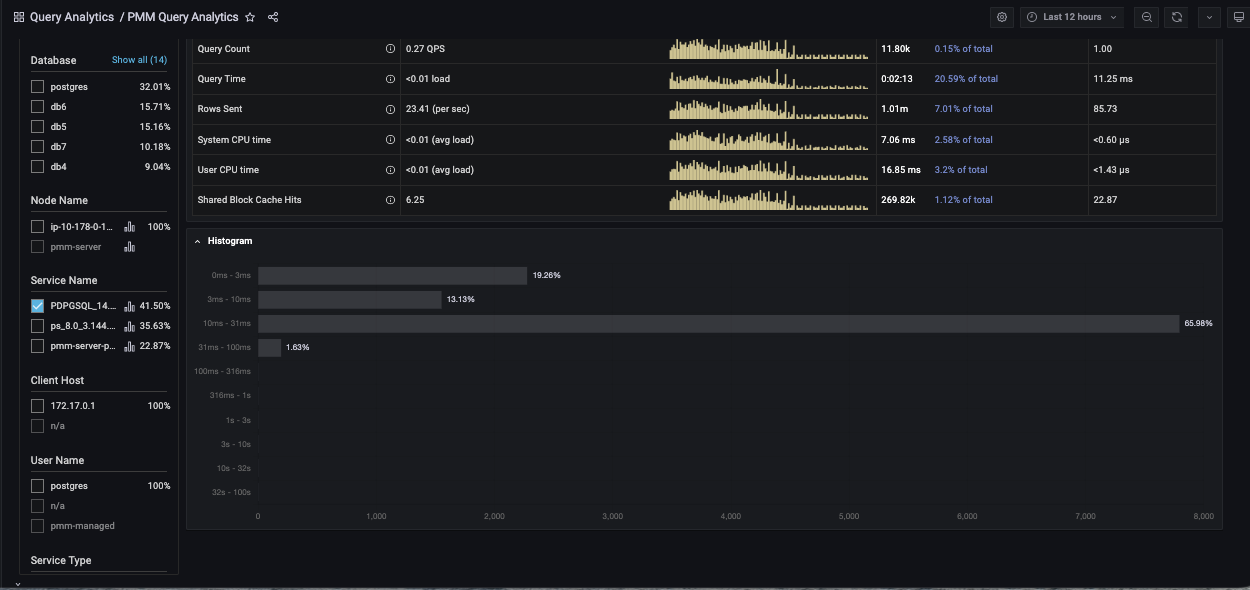
Other useful metrics (when using pg_stat_monitor) to monitor PostgreSQL Server performance are Histograms.
Histograms provide more explicit information about number of queries for fingerprint (queryid). Ranges are from 0 seconds up to 100 seconds.
Here is picture of histogram in graph:
Examples Tab
(For Query dimension.)
The Examples tab shows an example of the selected query’s fingerprint or table element.
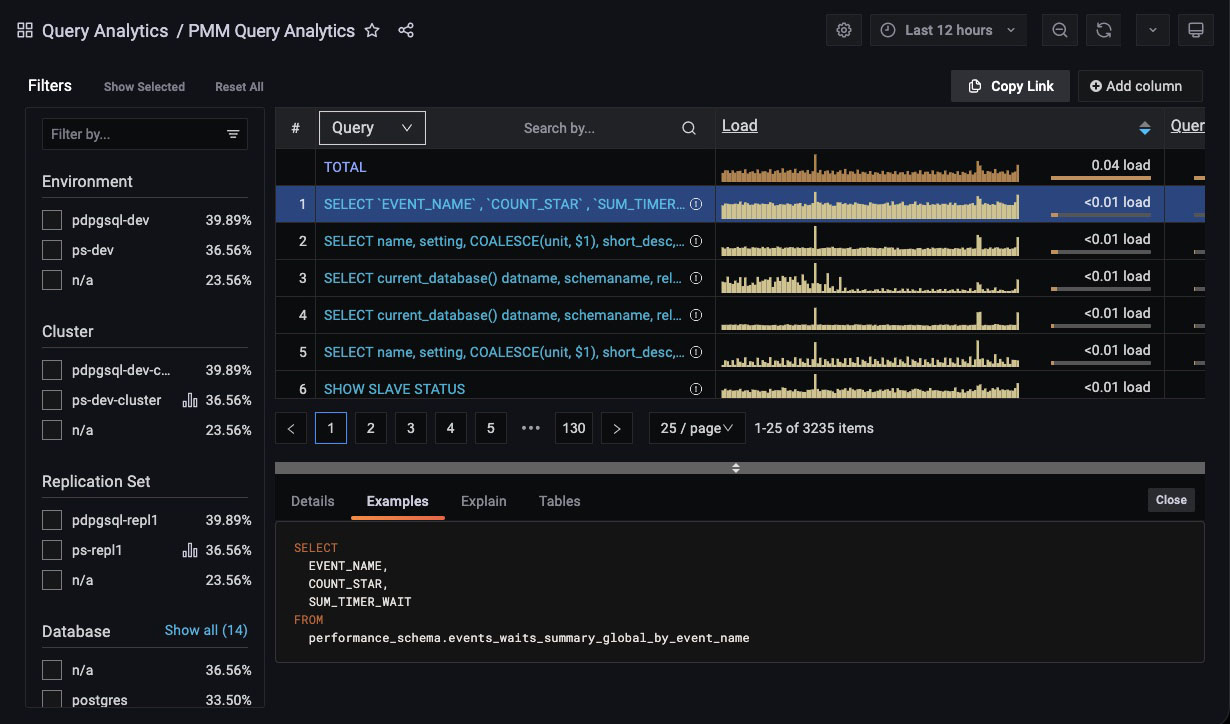
Query example and fingerprint can be truncated to 1024 long to reduce space usage. In this case, the query explains section will not work.
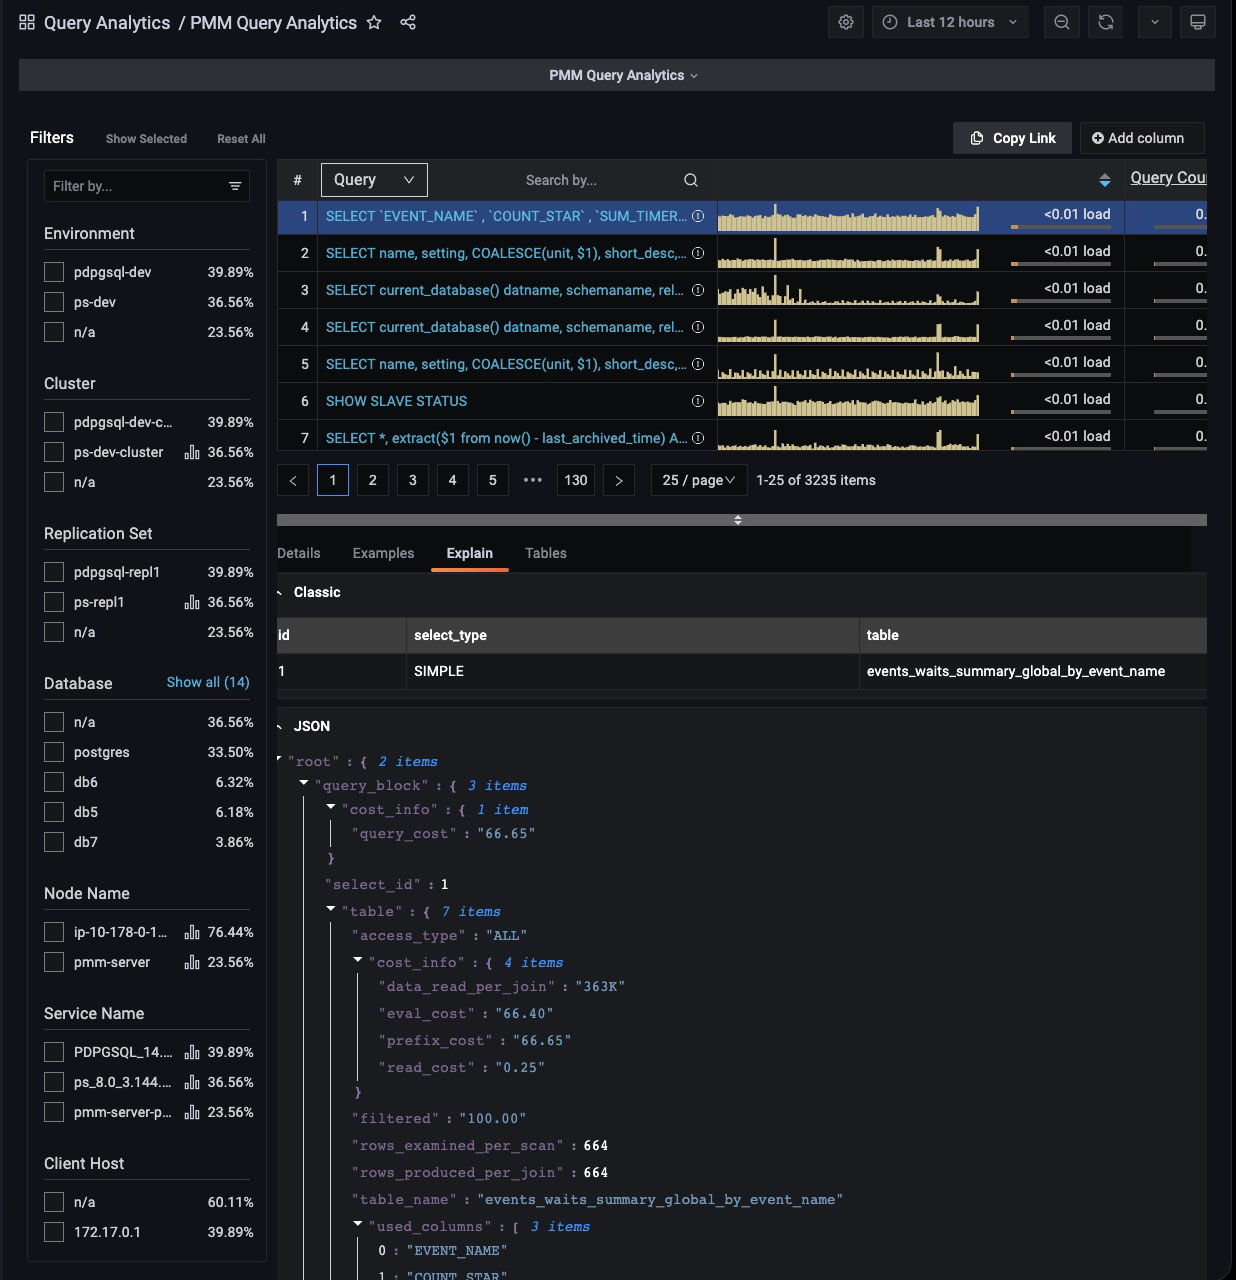
Explain Tab
(For Query dimension.)
The Explain tab shows the explain output for the selected query, in Classic or JSON formats.
- MySQL: Classic and JSON.
- MongoDB: JSON only.
- PostgreSQL: Not supported.
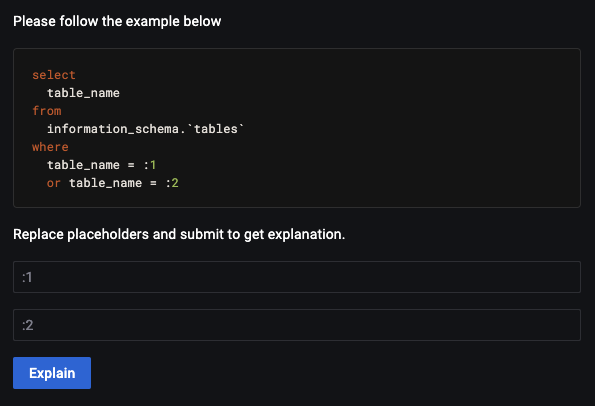
Starting with PMM 2.33.0, for MySQL, the Explain tab is supported without the Examples enabled. If a query in the Explain tab contains sensitive data, placeholders will replace them. Before you can run Explain, you must specify the values for these placeholders. This image illustrates the query with placeholders.
Below is an illustration of the same query using values instead of placeholders.
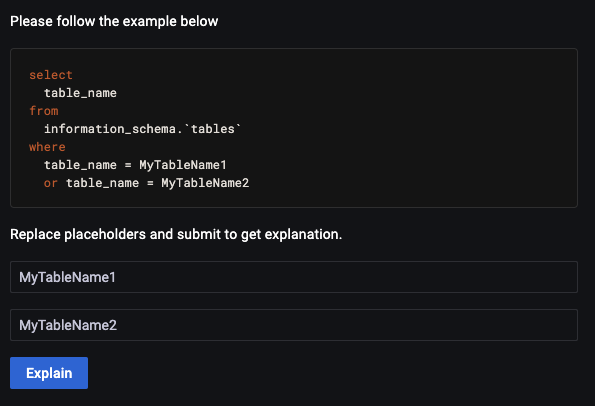
The image shown above illustrates a query with two placeholders. Therefore, you must enter the correct values in both fields. After filling in these values, click Explain to get the results like in the previous PMM versions without data leaks.
You will get result like in previous PMM versions. This method of explain prevents data leak.
‘Explain’ for MongoDB
To run Explain you need the same permissions as for executing the original query. For example, to run explain on updates you need update permissions.
Example: Grant the explainRole with update permissions.
db.grantPrivilegesToRole( "explainRole", [ { resource: { db: "", collection: "" }, actions: [ "update" ] } ])
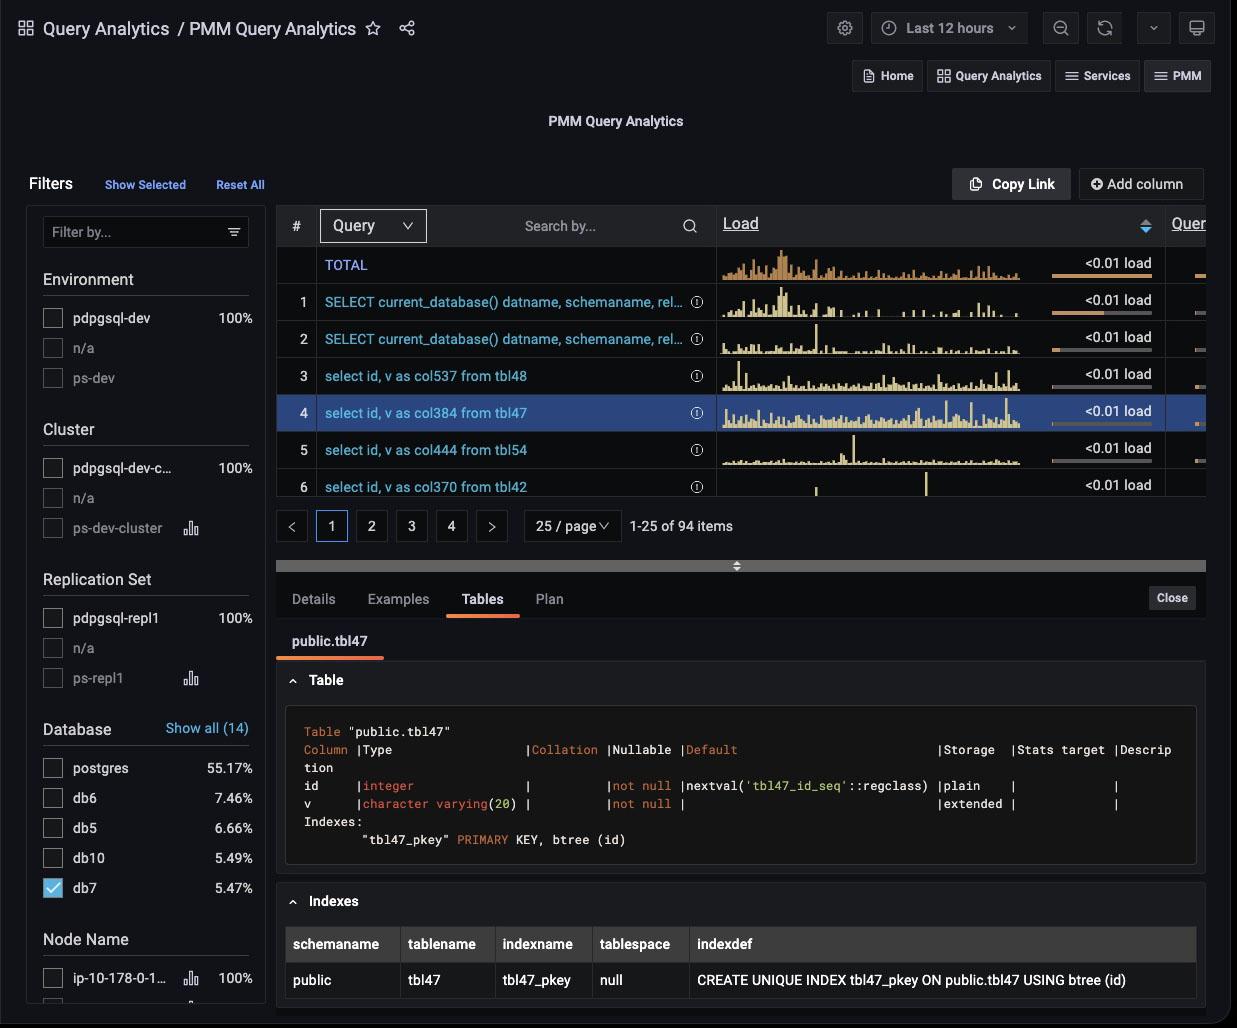
Tables Tab
(For Query dimension.)
The Tables tab shows information on the tables and indexes involved in the selected query.
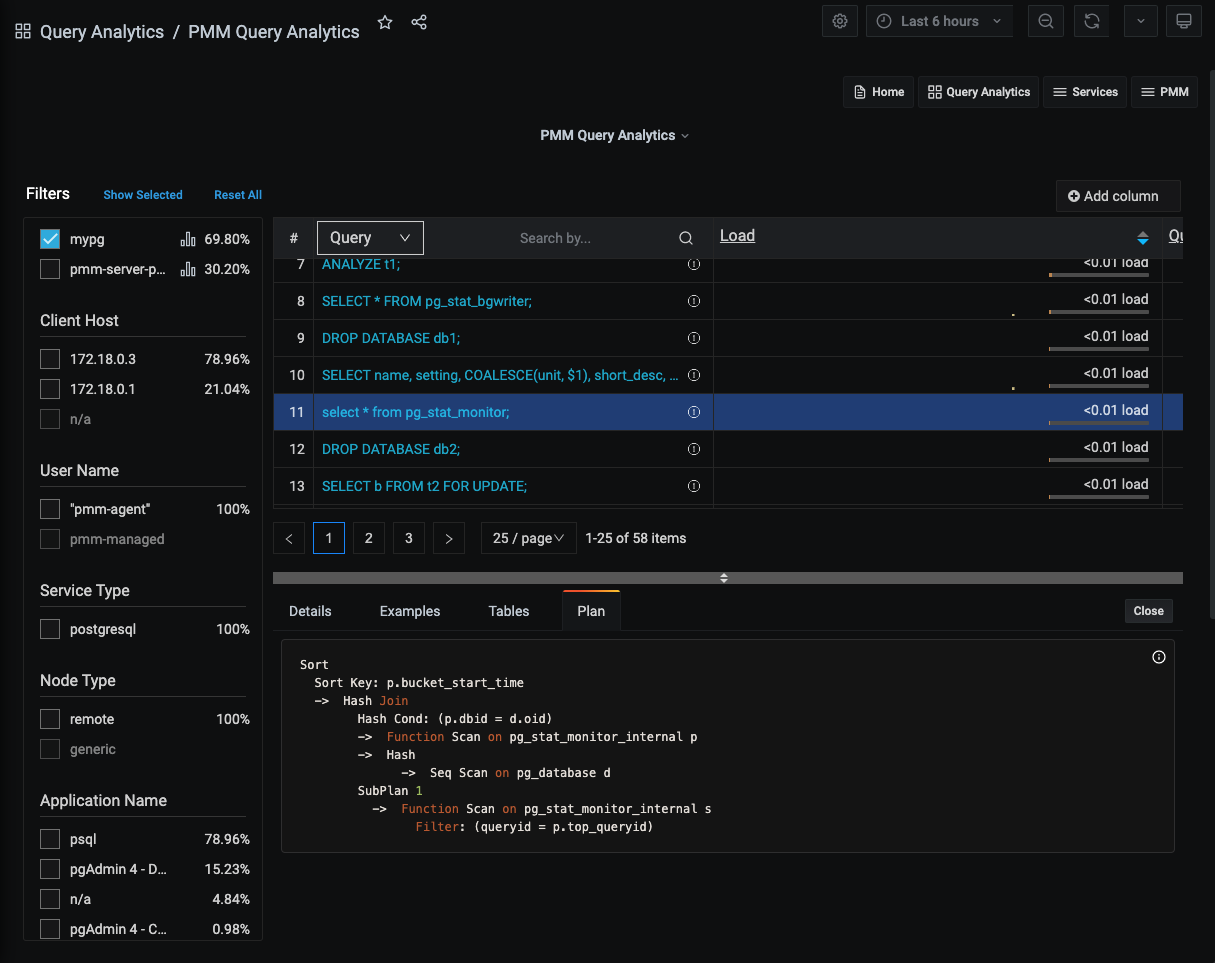
Plan Tab
(For Query dimension.)
The Plan tab shows the plan for PostgreSQL queries (only available when using pg_stat_monitor).
Get expert help
If you need assistance, visit the community forum for comprehensive and free database knowledge, or contact our Percona Database Experts for professional support and services.