Filters Panel
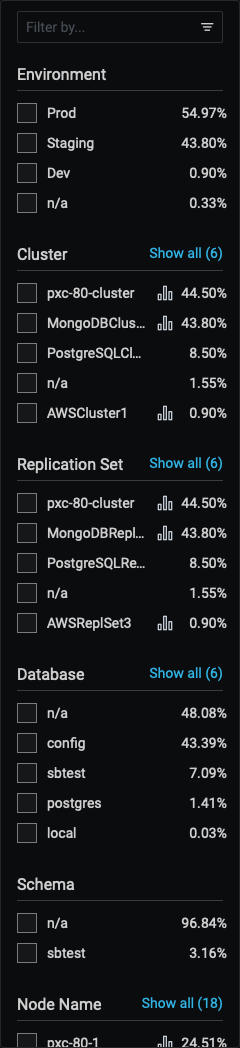
- The Filter panel on the left hand side of the dashboard lists the filters grouped by category. It also shows the percentage of the main metrics (explained below). If you select a different metric, the percentages on the left panel will change as per this metric. When you select a metric, it reduces the overview list as per the matching filter.
- The first five of each category are shown. If there are more, the list is expanded by clicking Show all beside the category name, and collapsed again with Show top 5.
- Applying a filter may make other filters inapplicable. These become grayed out and inactive.
- Click the chart symbol to navigate directly to an item’s associated dashboard.
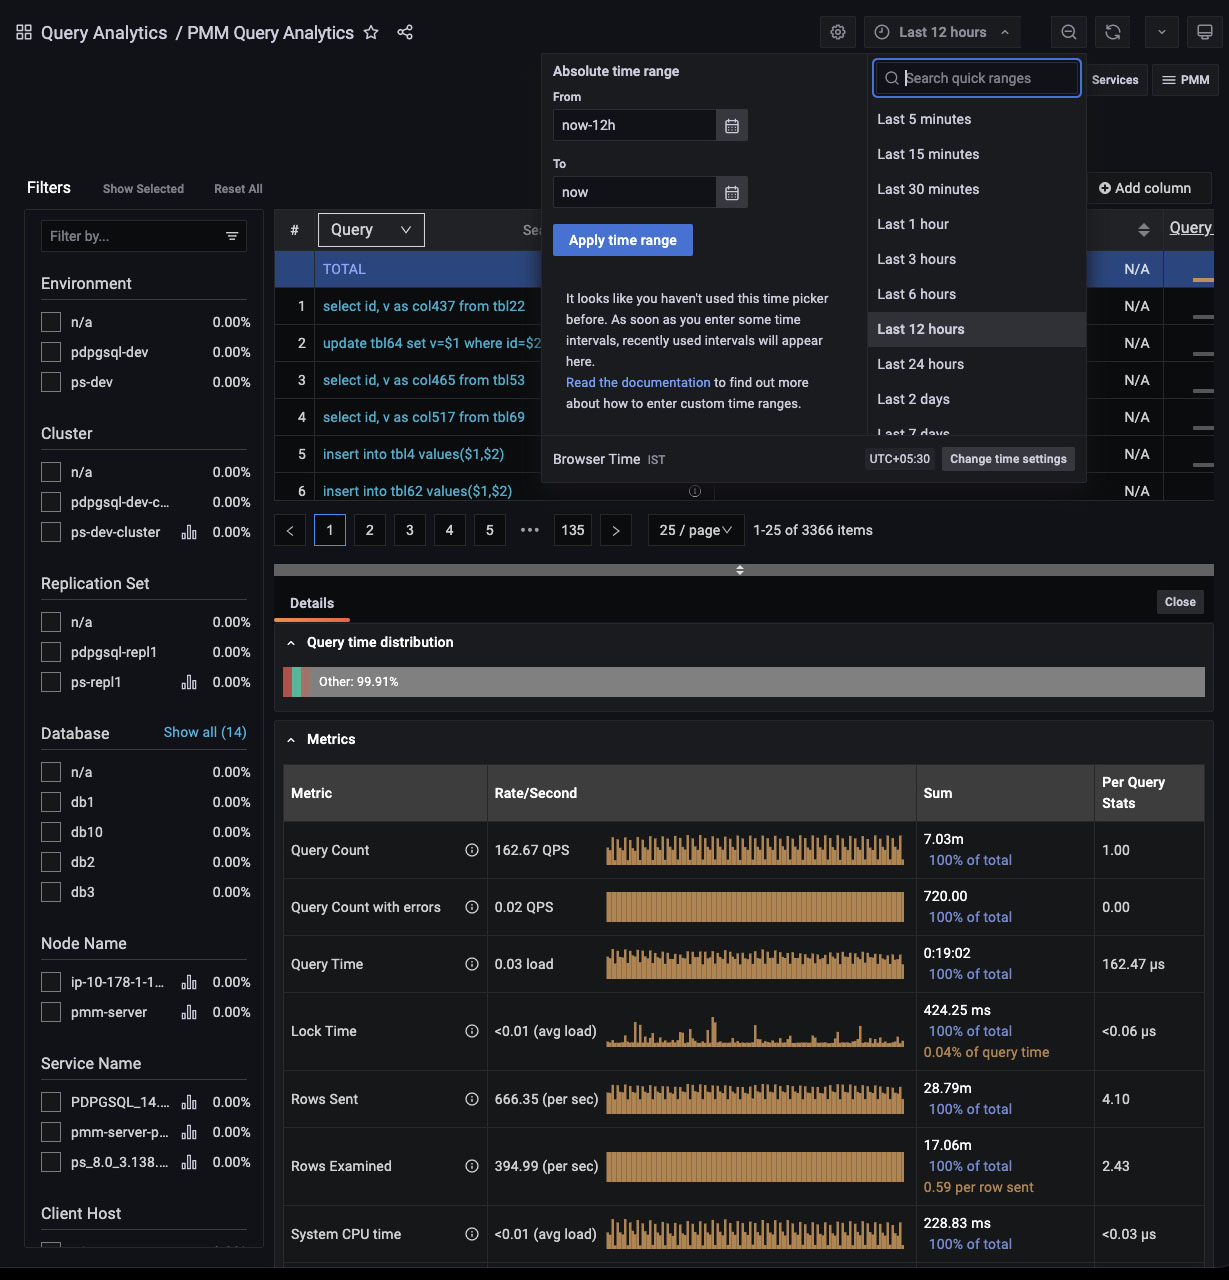
- Separately, the global Time range setting filters results by time, either your choice of Absolute time range, or one of the predefined Relative time ranges.
Custom filter groups
Important/Caution
This feature is still in Technical Preview and is subject to change. We recommend that early adopters use this feature for testing purposes only.
Starting with PMM 2.38.0, you can filter queries by custom filter groups based on key=value pairs separated from query comments. By default, this feature is disabled.
Supported technologies and agents
- MySQL (
perfschema,slowlog), - PostgreSQL (
pg_stat_statements,pg_stat_monitor)
Example
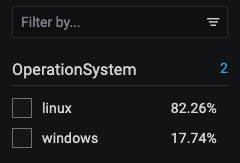
In the image above we have tagged queries running databases on Windows using the following comment:
comment: /* OperationSystem='windows' */.
/* OperationSystem='linux' */.
All types of comments and multicomments are supported (/* */, --, # etc).
So the queries are as follows:
SELECT * /* OperationSystem='windows' */ FROM city;
SELECT city /* OperationSystem='linux' */ FROM world;
In the output, you can see another custom group in the OperationSystem filter. Use this to easily filter by any custom key or value.
Enabling custom filter groups
-
CLI: While adding a service through CLI use the flag
comments-parsing. Possible values areon/off.Example for adding MySQL with comments parsing on:
pmm-admin add mysql --username=root --password=root-password --comments-parsing="on" -
UI: While adding a service through the UI you will see new checkbox to
enable/disablecomments parsing for current service.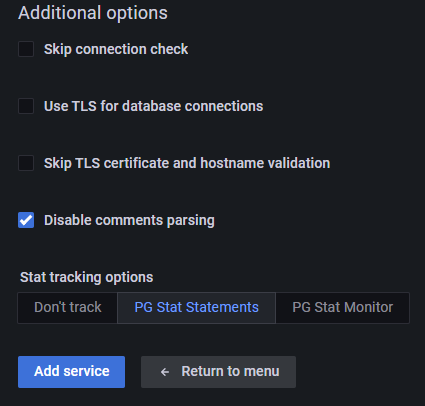
MySQL CLI
- If you are using official MySQL CLI to trigger queries, start mysql with
--commentsflag. Otherwise comments will not be parsed. - In case of PGSM (
pg_stat_monitor), set the DB variablepgsm_extract_comments=yes
Get expert help
If you need assistance, visit the community forum for comprehensive and free database knowledge, or contact our Percona Database Experts for professional support and services.